Description
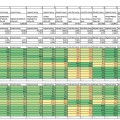
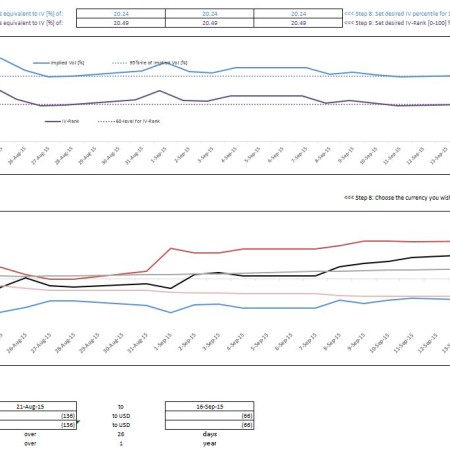
This Excel spreadsheet calculates the returns statistics of a set of user-defined tickers:
You may use any ticker available in Bloomberg that has historical data:
- Currencies (Curncy)
- Fixed Income (Govt, Corp, Mtge)
- Commodities (Comdty)
- Equities (Equity)
The returns statistics include:
mean, standard deviation, correlation, and beta (correlated standard deviation).
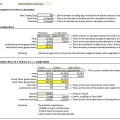
It includes an example of setting up a beta-neutral relative-value portfolio of 2 securities.
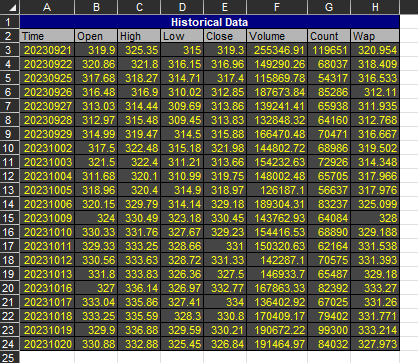
The data is pulled from Bloomberg, so you need to have run this on a PC with Bloomberg installed.
Please contact us
if you have requests to customize the spreadsheet.
Requirements:
- Microsoft Excel 2013
- Bloomberg API (for live data refresh)



Reviews
There are no reviews yet.